
Ratios to the Rescue
Previously, as part of our company metric series, we explored liquidity ratios. This week we’re diving into profitability and profitability ratios.
Calculating your company’s profitability ratios can be a great way for a business owner to measure efficiency, success, and performance in the two key areas of margins and returns.
What is Profitability?
Before we explore profitability ratios we must first understand profitability itself. Very crudely, profit is an absolute number depicting a company’s income or revenue less its expenses.
For example, the gross profit of a company is its gross revenue less its cost to service that revenue. Similarly, the net profit of a company is its gross revenue less its cost to service that revenue, less its operating expenses, and less its other expenses. Net profit is the “bottom line” of the income statement.
However, profit “margins” or “ratios” are relative numbers depicting the relationship between two absolute numbers.
For example, the gross profit margin of a company is its gross profit divided by its revenue and shown as a percentage. Similarly, the net profit margin of a company is its net profit divided by its revenue and is also shown as a percentage. Margins are a considerably easier way to see trends in performance and benchmark against industry averages.
Profitability Ratios
As we said above, profitability is a relative metric and will help you evaluate the performance of your company to generate profits. There are two types of profitability ratios that we will be discussing and they are margin ratios and return ratios.
Margin Ratios
Margin ratios help us measure how efficient a business is at turning its sales into profits.
Gross Profit Margin Ratio
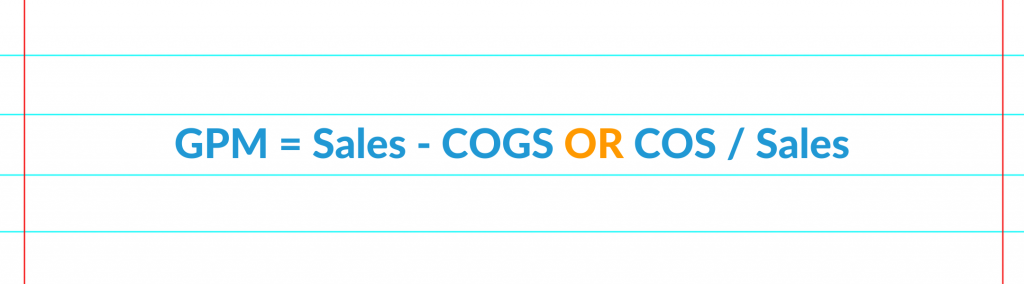
The gross profit margin or GPM shows a business’s profit margin after deducting costs of goods sold (COGS, for a product business) or cost of sales (COS, for a service business) but before deducting operating expenses, interest expenses, and taxes. GPM is a measure of how efficiently a business uses its labor and materials in producing its products or services.
To understand your business’s efficiency in terms of GPM, a higher GPM will tell you that your business has more money left over to pay for its operational expenses (and invest further in the business), while a lower GPM (when compared to industry averages) indicates your business has a lower percentage of sales that can be used to pay for expenses (i.e. you have a limited or tight budget). A limited budget would mean that you have less money to allocate elsewhere like re-investing in the business.
Understanding your GPM, and how it compares to your peers, is important because it gives you a starting point for building a healthy business. So what GPM should your business be shooting for exactly? The answer will differ depending on your industry and business size, but as an example, the following are the average GPMs for some of the typical industries that we serve:
- SaaS: 67%
- Beverage (Alcoholic): 49%
- Consumer Goods: 51%
- Information Services: 51%
- Beverage (Soft): 56%
Operating Profit Margin
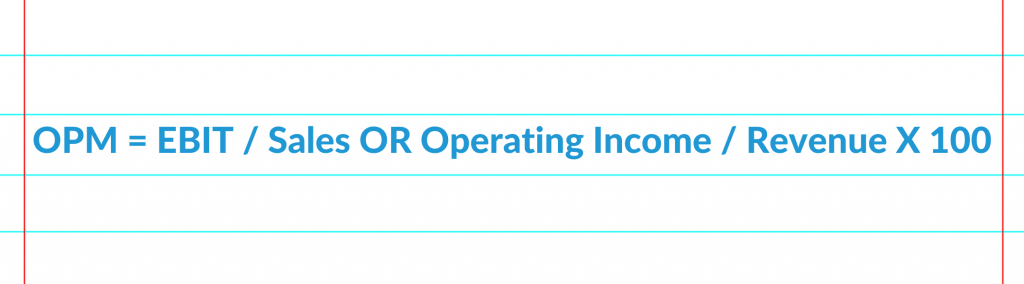
Operating profit margin or OPM is the profitability of a company (i.e. its earnings) before interest and tax and after deducting COGS or COS and operating expenses. A rising OPM over time points to a consistently healthy bottom line as your company is growing in size, thus its operations are growing too. Because of this indication, the OPM can also be used to point to unnecessary expenses that can crop up and help you boost your bottom line by implementing cost-saving measures.
OPM is another profitability ratio that will vary based on your industry and business size. For example, a small independent retail business will have a lower OPM than a large, national-chain retailer, because the small business will need higher margins to cover their costs and still make a profit, where the large business can operate with lower margins because of their high sales volume. Using your OPM to compare your business to like businesses is a great way to see how you measure up to others in your industry since the OPM does not take into account variable costs. Because of this fact, investors may also use the OPM to determine how well a potential investment stands up to other potential investments.
Net Profit Margin
Net profit margin (NPM) is THE main financial measure that investors and financial analysts use to view the bottom line profitability of a business. This is mainly because NPM is a business’s profitability minus all of its costs and expenses (i.e. it is the profit left over at the end of the day for distribution to shareholders). The one caveat of the NPM, though it is widely used among investors, is it is considered less precise than the GPM and OPM because it takes into account all costs and expenses not just those associated with the company doing business. A good example of this is that one tech company in Boulder may foot the bill for a weekly team lunch, where another tech company in Fort Collins works entirely remotely – the expenses outside of the cost of doing business for these two businesses will vary greatly.

Looking at your business’s NPM is a great indicator of its health because by tracking your NPM you can forecast projected profits and determine if your current spending and investment patterns are in line with what your business generates and thus is able to cover in expenses. One thing to consider when reviewing your profit margins is that the key difference between your OPM and your NPM is that your NPM will take into account any interest you’re accruing such as that associated with financing.
As a rule of thumb, a good NPM is 10% (a really great NPM is 20%+) and a low NPM is 5%, BUT NPM also varies across industries. Following are examples of average NPMs by industry, provided by Brex, so you can see the wide range:
- Beverage (soft): 18.50%
- Computer services: 4.34%
- Retail (general): 2.44%
- Retail (grocery and food): 1.44%
- Retail (online): 4.57%
- Software (system and application): 19.54%
Return Ratios
After margin ratios, we’re left with return ratios which represent the returns a business generates for its investors or shareholders.
Return on Assets
Return on assets or ROA measures the return earned on the total assets in use by a business and is a measure of how efficiently a business is at managing its assets to create profit. In super basic terms, you can view ROA as how much profit a business can create per dollar.

Your ROA can be used to compare your business to its prior performance or to compare your business to very similar companies. This will give you an idea of how well you are doing at converting invested money into income, with the goal being a higher ROA number, the better. This would mean that your business is earning more money on less of an investment. Given this, it’s easy to see that different industries will have different ROAs since assets are used variably across industries. For example, a B2B service firm, like a Boulder accounting firm, will have a higher ROA than say a Denver construction company, which is a very capital-intensive business.
Return on Equity
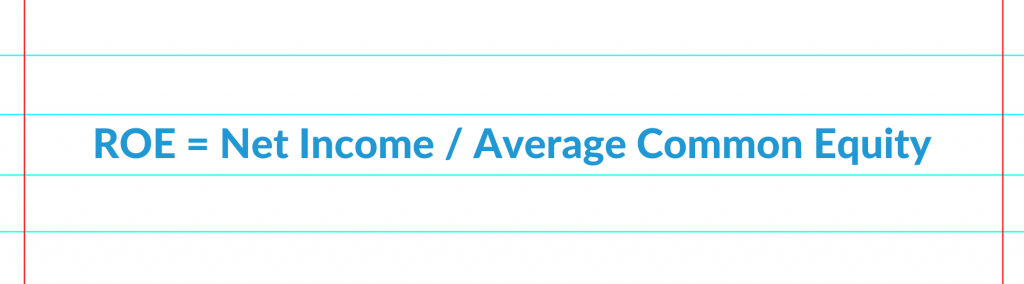
Return on Equity (ROE) measures the return a business earns on capital provided by shareholders or equity holders. Where ROA measures profitability by a business’s ability to turn assets into profit, ROE measures profitability by how a business turns investments into profit. As such, ROE is used as a determinant for potential investors to invest in your business.
Too little ROE shows that your business is not effectively using equity to generate returns, but high ROE can also be a negative indicator. A high ROE may mean that the company has inconsistent profits, high debt, or even a negative net income. Ideally, your ROE should be around 15-20% and it is best to look at your ROE over a longer period of time to determine if it is sustainable in the long term.
Why Are Profitability Ratios Important? It’s All Relative.
So we’ve talked through five different profitability ratios, gross profit margin, operating profit margin, net profit margin, return on assets, and return on equity, but why are they so important?
- They provide financial insight. At their core profitability ratios can tell both business owners and investors about the bottom-line health of a business and will also point towards where improvements can be made. For example, if your OPM is growing as your business grows year over year, then you’re able to cover your operating expenses as your business gets larger and larger and so do your operations. Or if you’re an investor, you can view a business’s ROE over the past five years to determine how efficiently they use current equity investments and if they’re a good fit for your investment preferences.
- Opportunity for comparison. As we mentioned in our introduction, profitability ratios are relative numbers, which means they are great for comparison purposes. They can be used to compare your business year over year or month over month to determine if you have improved, and they are also great for comparing your business to similar-sized businesses in your industry. For most ratios, having a higher value than your competitor is a sign that your business is healthy and profitable.
- Evaluate improvement. Like most financial metrics, including profitability ratios, tracking them over time provides an opportunity to identify areas of improvement. Is your business’s performance getting better or worse over time? How is your business doing when compared to the overarching industry? What changes can you make to improve your profitability and make your business more attractive to investors?
- Funding options. Most businesses seek external financing at some point in their growth journey, and both lenders and investors use profitability ratios to determine if a business is profitable, sustainable and whether they are a sound enough company to invest in (i.e. they will be able to pay their debts or provide a return to equity holders).
Profit & Profitability
In the grand scheme of financial metrics, profitability ratios provide serious bang for their buck and allow business owners to understand the health of their company and opportunities for improvement while also providing lenders and investors insight into funding your business.
If you find your company’s profitability ratios lacking in the wow department, Simple Startup is ready to partner with you to get a better handle on your company’s finances and find opportunities for improvement that will get your business on track for your unique goals. All you have to do to call on us is schedule time on our calendar and then we can team up on a great plan for the future of your business.
Book a Discovery Call Today, We’re So Ready to Help >>
Need help tracking all these metrics? Download our handy metric tracker and library here.